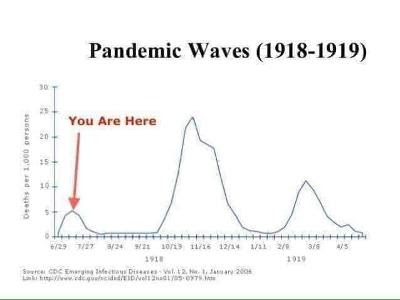
CDC graph improved by Down With Tyranny:

All too credible with so many states deciding to give up on anti-pandemic rules while COVID-19 is still just as widespread
To be fair, no one knows what the true R0 (the rate of reproduction of the infection) is for the US; indeed in a country this size one might more reasonably speak of different R0s for different parts of the country. But even if R0 is currently just below one, which it might be given the US infection rate has plateaued and even trended down a tiny little bit, that’s thanks to all the state-imposed ‘social distancing’. Change the rules and the infection rate surely will go back up again.
I live in a state in which all but the very southern part is, our governor says, about to “reopen”. Looking at that graph at the top, it seems all too likely that we’re not learning anything from history.

Even two weeks after this posting it’s still true that if you take New York out of the graph the infection rate is still climbing in the rest of the country.Even the UK has different R0 numbers depending what part of the country you look at, so yes, it makes no sense to talk as though the US has only one.
In the UK there’s been a lot of discussion of how to avoid the second spike seen with the 1918 Spanish flu. There’s a lot you can move outdoors in the UK in the summer (unlike Florida!) into relative safety that is either going to have to stop when the weather darkens in October or be seriously changed. The key in any case will be identifying hotspots as early as possible and shutting them down before spread can resume. And for that you need a lot of rigorous testing and tracing, which in turn requires a commitment to science…and leadership.
wg